POLICE SCORECARD PROJECT METHODOLOGY
ABOUT THE POLICE SCORECARD
The Police Scorecard is the first nationwide public evaluation of policing in the United States. The Scorecard calculates levels of police violence, accountability, racial bias and other policing outcomes for over 16,000 municipal and county law enforcement agencies, covering nearly 100% of the US population. The indicators included in this scorecard were selected based on a review of the research literature, input from activists and experts in the field, and a review of publicly available datasets on policing from federal, state, and local agencies. This project is designed to help communities, researchers, police leaders and policy-makers take data-informed action to reduce police use of force, increase accountability and reimagine public safety in their jurisdictions.
PROJECT DEVELOPMENT, REVIEW, AND REFINEMENT
The Police Scorecard project was built by Samuel Sinyangwe and a team of data scientists, designers, developers, organizers, and students from across the country who believe in the power of data as a tool for justice, accountability and measurable change. This project and its methodological framework will continue to be updated over time in response to feedback and as more data are made available by local, state, and federal agencies. This includes incorporating additional indicators such as police stops and searches, police militarization, policies and procedures, and disciplinary outcomes. The full database, including source documentation, can be accessed here. We've also built an API for the Police Scorecard that can be accessed here. If you have data to add to this project, analysis or visualizations using the data, or general inquiries, contact us.
Data Team
Allie Monck
Olivia Orta
Ritesh Ramchandani
Peter Schmalfeldt
Ariel Matos
Kirby Phares
Emily Biondo
Mary Hammond
Partners
MapBox
MuckRock
Tableau
Research Advisors
Bocar Ba, Assistant Professor of Economics, UC Irvine
Jeffrey Fagan, Professor of Law, Columbia University
HOW WE COLLECTED THE DATA
The Police Scorecard integrates data on police arrests, personnel, funding, incarceration rates and homicide clearance rates from official federal and state databases such as the FBI Uniform Crime Report (UCR), the Bureau of Justice Statistics' Annual Survey of Jails, the US Census Bureau's Survey of State and Local Government Finances and the California Department of Justice's OpenJustice database. Where agencies did not report data to one of these programs, data were sourced from local agency publications and media reports. We also obtained data on killings by police from media reports, crowdsourced databases and official reports, documenting each case in which police directly caused the death of another person through the use of a firearm or any other type of force. Finally, data on non-fatal police use of force incidents and police misconduct complaints were obtained directly from police agencies via public records requests, annual reports and departments' open data sites. The full list and descriptions of each data source used in this project can be found in Appendix A below.
HOW AGENCY SCORES ARE CALCULATED:
There are substantially different perspectives about what police should or should not do - and whether the institution of policing should continue to exist at all. These differences cannot all be resolved at once, but we believe there are a set of common principles that can provide an initial framework for evaluating any agency that responds to issues of public safety:
- The agency should prioritize addressing serious threats to public safety, not arresting or incarcerating people for low level offenses
- The agency should avoid the use of force, especially deadly force, to the greatest extent possible
- When people come forward to report misconduct by employees of the agency, it should result in some form of accountability
- When people call on the agency to solve the most serious crimes - those resulting in death - they should be able to trust that agency to find the person responsible
- The agency should accomplish these goals in ways that are not biased or discriminatory
Based on these principles, we obtained data from federal, state and local databases to evaluate over 13,200 municipal police departments and 2,800 county sheriff's departments, represented by a "score" from 0-100 with a score of 0 representing the worst outcomes and 100 representing outcomes most consistent with the principles stated above. The scores attributed to police agencies in our analysis should be interpreted as relative scores, showing how each agency compares to other agencies across four areas of policing: police violence, police accountability, police funding, and an evaluation of each agency's approach to law enforcement (for example, the extent to which an agency focuses on arresting people for low-level offenses or addressing serious crimes).
Using this methodology, a police department received a higher grade if it made fewer arrests for low level offenses, used less force during arrest, fewer racial disparities in arrests and use of force, spent less money on policing, and upheld civilian complaints of police misconduct more often than other agencies. In order to ensure appropriate comparisons among agencies with different roles and jurisdictions, municipal police departments are evaluated in comparison to other municipal police departments of similar sized jurisdictions and county sheriff's departments are evaluated in comparison to other county sheriff's departments of similar sized jurisdictions (jurisdictions with over 250,000 population are compared to one another, as are jurisdictions with 100,000-249,999 population, jurisdictions with 50,000-99,999 population, and those with < 50,000 population).
HERE ARE THE FACTORS THAT WERE USED TO CALCULATE EACH AGENCY'S SCORE:
POLICE FUNDING SCORE
The police funding score renders the amount of resources cities and counties spend on policing compared to other issues such as public health and housing/homelessness. This includes indicators measuring the total amount of budgetary expenditures on police and sheriff's departments, the average amount of money spent on police misconduct settlements (which usually are not paid from police budgets) and the amount of money taken from communities by law enforcement through fines and asset forfeiture. The police funding score also includes a measure tracking the total number of officers per population in each jurisdiction, since the size of the police force structures the police budget and evaluates the level of overall policing/police presence in communities (for example, surveys of law enforcement agencies find personnel costs such as officer salaries and benefits comprise an average of 85% of police budgets). Under the Police Scorecard's methodological framework, cities and counties that invest more resources per capita in policing communities and/or that impose more financial burden on communities through the use of fines and property seizures receive a lower score. The following formula was used to calculate this score:
(
    Percentile Police Funding per Population +
    Percentile Number of Officers per Population +
    Percentile Average Funds Spent on Misconduct Settlements +
    Percentile Funds Taken From Communities in Fines and Forfeitures per Population
) / 4
POLICE VIOLENCE SCORE:
The police violence score takes into account how often police used higher levels of force against people including any time police discharged a firearm or used a taser, baton, OC spray, impact projectile or stranglehold against a civilian. Since the vast majority of use of force incidents occurred during an arrest, consistent with previous research we benchmarked use of force incidents against the total number of arrests made and then factored in the severity of force used and whether the people force was used against were unarmed into each police department's police violence score.
Racial disparities in deadly force were also factored into each department's police violence score. To calculate a racial disparity score for killings by police, we calculated the disparity in rates of killings by police per population between Black and white populations and between Latinx and white populations, taking the most extreme of the disparities between the two and then converting this to a percentile score relative to other departments. In summary, the following formula was used to calculate each department's police violence score:
(
    Percentile Less Lethal Force Used per Arrest +
    Percentile Deadly Force Used per Arrest +
    Percentile Unarmed Civilians Killed +
    Percentile Racial Disparities in Deadly Force
) / 4
POLICE ACCOUNTABILITY SCORE
The police accountability score evaluates the extent to which investigations into civilian complaints of police misconduct result in a sustained finding of misconduct against the officers involved, which is usually the first step to imposing disciplinary consequences. The score accounts for both how police departments compare with one another in terms of their overall civilian complaint sustain rate and the severity of the misconduct allegations that were sustained against officers. For example, complaints alleging police committed a criminal offense and complaints alleging police used excessive force or discriminated against people received additional consideration compared to other allegations. The following formula was used to calculate this score:
1/2 ( Percentile Civilian Complaints Sustained ) +
1/2 ( Percent Discrimination, Excessive Force and Criminal Complaints Sustained )
APPROACH TO LAW ENFORCEMENT SCORE
The approach to policing score evaluates the extent to which police departments focus on arresting people for low-level offenses or focusing on solving serious crimes. The score accounts for the proportion of the most serious crimes - homicide - that an agency solves as well as how each agency compares in terms of its approach to the lowest level offenses. We defined low level offenses as the combination of all arrests for drug offenses, public drunkenness and other alcohol-related offenses; vagrancy, loitering, gambling, disorderly conduct, prostitution, vandalism, and other minor non-violent offenses. These types of offenses are usually classified as misdemeanors and are often associated with issues of substance abuse, homelessness and sex work. This definition excludes all arrests for violent crimes, assaults, crimes against families and children, weapons offenses, sex offenses and all arrests for property crimes except for vandalism.[1] Higher rates of low level arrests per population suggest a department is engaging in aggressive "public order" or "broken-windows" policing practices that have not been proven to improve public safety and instead expose communities, especially marginalized communities, to increased policing, arrest and incarceration (for additional reading, see here, here and here). Racial disparities in drug arrests were also factored into a department's approach to policing score. Since there are similar rates of drug use and drug sales among most racial and ethnic groups, disparities in which groups police arrest for drug offenses suggest a biased approach to law enforcement. As such, we used data on racial disparities in drug arrests as a proxy for estimating racial bias. We calculated racial disparities both between Black and white populations and between Latinx and white populations, converting the most extreme of these two disparities to a percentile score for racial disparities in law enforcement.
(
    Percentile Low Level Arrests per Population +
    Percentile Racial Disparities in Drug Arrests +
    Percent Homicides Cleared
) / 3
EVALUATING COUNTY SHERIFF'S DEPARTMENTS
The Police Scorecard currently includes 2,878 county law enforcement agencies, covering 92% of all US counties (the remaining counties are largely policed by state police). In addition to the indicators used to evaluate municipal police departments, we added a set of indicators to evaluate county Sheriff's Departments that reflect their role in operating County Jails. This data includes:
1. Percentile of Jail Incarceration Rates per 1,000 Residents, 2019
This indicator displays each County Sheriff's Department's Average Daily Jail Population in 2019 divided by the total population of the Sheriff's Jurisdiction. This data was obtained from the Bureau of Justice Statistics 2019 Census of Jails (the most recent survey we could find with data on this issue that has been made public). Importantly, since sheriff's departments have primary jurisdiction over unincorporated areas within counties and the cities that do not operate their own police departments (these cities contract with the sheriff's department for law enforcement services), we estimated the total population of each jurisdiction by subtracting from the total county population the populations of each city that has its own municipal police department.
2. Percentile of Jail Deaths per 1,000 Avg Daily Jail Population, 2013-2020
This indicator displays the rate of deaths within each county's jails per 1,000 jail population from 2013-2020, based on data compiled by Reuters investigators. To calculate this indicator, we divided the total number of jail deaths within each county from 2013-2020 by the countywide Average Daily Jail Population. We also included information about the reported cause of death in these cases.
3. Percent of Civilian Complaints in Detention Sustained from 2016-2024
This indicator displays the percentage of reported complaints in detention that were sustained from 2016-2022, as determined by the California Department of Justice's CCOPA database and data obtained from county agencies via public records requests.
4. Number of People Transferred to ICE in 2019
This indicator displays the number of people transferred to Immigration Enforcement from local jails in 2019 (previous years of data were unavailable), as reported to the Census of Jails 2019. Additionally, more detailed information on ICE transfers, including the proportion of transfers by alleged offense type is displayed for departments in California based on data obtained from the California Department of Justice's Values Act Transfers database.
5. Percent of People in Jail Without Being Convicted, 2019
This indicator evaluates the use of pre-trial detention within each County Sheriff's Department's jail. It measures the total number of people in each jail who were not yet convicted of the crime associated with their incarceration divided by each agency's total jail population, as reported to the Bureau of Justice Statistics 2019 Census of Jails. Since this was a one-time snapshot of each jail population on June 29, 2019, we used the total jail populations reported to the survey rather than average daily jail populations to evaluate the percent of the total who were unconvicted.
The first two of these indicators were included in each Sheriff's Department's initial Approach to Policing Score as such:
(
    Percentile Low Level Arrests per Population +
    Percentile Racial Disparities in Drug Arrests +
    Percent Homicides Cleared +
    Percentile Jail Incarceration Rate +
    Percentile Jail Deaths per Jail Population
) / 5
The Percent of Complaints in Detention Sustained are already incorporated into each department's overall complaint sustain rate which contributes to their Police Accountability Score. Additional indicators, including Transfers to ICE, will be factored into each department's score over time as we obtain more years of data to evaluate these issues. For example, we only have access to one year of data on ICE transfers: 2018.
APPENDIX A:
DATA SOURCES:
KILLINGS BY POLICE
DEFINITION: PEOPLE KILLED BY LAW ENFORCEMENT OFFICERS FROM 2013-2025.
We obtained information on people killed by police from 2013-2025 sourced from public records requests, local media reports and other crowdsourced databases such as the Fatal Encounters database. This includes information on nearly 15,000 people killed by police nationwide from 2013-2025, 91% of whom were killed by one of the law enforcement agencies currently represented in the Police Scorecard. Importantly, sourcing information from media reports and crowdsourced databases in addition to official databases allows for a more comprehensive evaluation of killings by police than would be possible using official data alone, since only about 60% of the nation's law enforcement reports data to the federal government's Use of Force Data Collection program and that data still has not been released publicly. Our approach is also more expansive than the Washington Post's police shootings database because it includes cases where people are killed by types of police use of force in addition to fatal police shootings (i.e. killings by tasers, batons, chokeholds and intentional vehicle strikes) as well as cases that occurred prior to 2015. The database also evaluates whether each person killed by police was armed with a gun, armed with another weapon or vehicle, or unarmed at the time of the incident. Cases were coded as unarmed when the person killed by police did not possess an actual weapon - which includes both people who had no object in their hands and people who had common/household objects like cell phones, spoons or a toy that may have been perceived to be a weapon but ended up not constituting a real threat.
POLICE SHOOTINGS (BOTH FATAL AND NON-FATAL)
DEFINITION: ANY INCIDENT WHERE A FIREARM WAS DISCHARGED AT A PERSON, REGARDLESS OF WHETHER IT CAUSED INJURY OR DEATH
In the absence of comprehensive federal data on police shootings, we obtained data on the total number of police shootings incidents per year from individual law enforcement agencies across the country via public records requests, media databases and official databases in states that track police shootings more systematically: California, Colorado, Georgia, Illinois, Maryland, Michigan, Minnesota, New Jersey, New York, North Carolina, South Carolina, Tennessee, Texas, Virginia and Wisconsin. Since California's URSUS use of force data collection program includes more detailed information about the circumstances of each police shooting incident - in particular which types of force were used in each incident - we were able to determine the proportion of each department's police shootings where officers discharged their firearms without attempting to use any less-lethal or non-lethal force option first or instead of escalating to deadly force. Similarly, the URSUS database requires agencies to report what objects, if any, officers perceived the person they used deadly force against to have and then what object they ended up being found to have as a result of the encounter. These data were used to calculate the proportion of police shootings incidents where police reportedly saw a gun but no gun was found.
LESS LETHAL FORCE
DEFINITION: THE TOTAL NUMBER OF USES OF TASERS, BATONS, PROJECTILES, PEPPER SPRAY, K-9S, OTHER WEAPONS AND STRANGLEHOLDS AGAINST CIVILIANS FROM 2013-2025
To obtain information on serious police use of force that did not rise to the level of deadly force, we submitted public records requests to the 500 largest police and county sheriff's departments nationwide asking for the total number of uses of force, by type of force used, from 2013-2025. The majority of these agencies sent us their data or published this information online. Detailed data showing use of force by force type for each responsive department can be found here. Each department varied in how they categorized and reported the use of force. For example, some police departments require officers to report all weaponless strikes and control holds used against a civilian, while others only require these types of force to be reported when they cause injury. Similarly, some departments require officers to report whenever they display a firearm or taser, while others only require them to report when these weapons are discharged. Given these reporting inconsistencies, we limited our analysis to more serious forms of force since these were more consistently reported and categorized among the agencies we obtained data from. This included uses of "less lethal" force or force involving weapons such as tasers, batons, impact projectiles, K-9s, OC/pepper spray, and neck restraints like carotid restraints or lateral vascular neck restraints.
Police departments also differed in how they counted uses of force when more than one officer used force during a single encounter. For example, in cases where two officers both used a taser on the same person, some departments count this as two uses of force while others count it as one use of force. We evaluated how each department counted use of force by examining their use of force reporting policies, use of force data, and by following-up directly with departments for clarification. Based on this information, we determined that most departments that sent their use of force data counted a situation where one officer uses the same type of force more than once as one use of force and counted as one use of force a situation where multiple officers use the same type of force against the same civilian.
Despite these efforts, we recognize there may still be differences that were unaccounted for within each department's internal system for compiling and reporting uses of less lethal force. Moreover, we could not account for the degree to which force may have been systematically underreported by some agencies. This is a living project: we will continue to update the information on our site in response to feedback from law enforcement agencies and the public.
CIVILIAN COMPLAINTS
DEFINITION: THE TOTAL NUMBER OF COMPLAINTS, BY TYPE OF COMPLAINT, REPORTED BY CIVILIANS AGAINST LAW ENFORCEMENT PERSONNEL FROM 2016-2024
The Police Scorecard includes the total number of complaints reported each year from 2016-2024, the number of those complaints that were sustained (i.e. upheld by investigators), with breakdowns for the total number of use of force complaints, complaints of police discrimination, and criminal complaints that were reported and the number of each that were sustained during that time period. To obtain these data, we submitted public records requests to local police and sheriff's departments and also requested data from state criminal justice agencies in the states that currently collect information on civilian complaints.
The composition and quality of these state databases varied substantially - as well as the types of information on this subject that we could obtain under each state's open records laws. For example, in California, all law enforcement agencies are required to provide the California Department of Justice with Citizens' Complaints Against Peace Officers (CCAPO) data through an annual summary. The information includes the number of criminal and non-criminal complaints reported by citizens, racial and identity profiling complaints, complaints of misconduct in jail (for sheriff's departments) and the findings from investigations into those complaints. In Maryland, by contrast, only the total number of sustained complaints involving an alleged criminal offense or a use of force incident causing death or serious injury are required to be reported to the state (and in many cases, agencies have failed to report even this information). Altogether, we found statewide databases containing at least some information on civilian complaints in California (total complaints by type of allegation and outcome), Maryland (sustained criminal complaints and complaints involving the use of deadly force), Texas (racial profiling complaints), New Jersey (administrative investigations by type and outcome), and Minnesota (criminal and administrative investigations by type of allegation).
There are important limitations to consider regarding the current availability of data on police accountability within the United States. There are no national standards or systems for reporting complaints of police misconduct. There are differences in how each agency classifies and investigates these complaints. For example, some agencies only reported data on the number of investigations conducted into complaints rather than the total number of complaints received. Others reported data only on the number of allegations reported and sustained, but not the number of overall complaints reported or sustained (a single complaint can contain more than one allegation of misconduct, for example an officer who is alleged to engage in both discriminatory policing and excessive force in a single encounter). Where individualized data was made available by agencies, we used it to calculate data at the complaint (rather than allegation) level. Our database will continue to be updated in response to more detailed data obtained from agencies.
ARRESTS
DEFINITION: THE TOTAL NUMBER OF ARRESTS REPORTED BY POLICE FROM 2013-2025.
Data on the number of each agency's arrests was obtained from the FBI Uniform Crime Report (UCR) for arrests made from 2013-2022. From 2023 onwards, we incorporate arrests data from the FBI National Incident-Based Reporting System (NIBRS), which replaced the UCR as the federal government's primary arrests database.
Calculating Racial/Ethnic Disparities in Arrests:
We used the reported number of arrests of Non-Hispanic Black people, Non-Hispanic white people, and Hispanic people (of all races) to calculate Black-white and Latinx-white arrest disparities relative to the 2020 Census population in each jurisdiction with available data. Unlike the earlier Uniform Crime Reporting system, the FBI National Incident-Based Reporting System provides detailed breakdowns of arrests by race and ethnicity, specifying the number of arrestees who were perceived to be Hispanic Black, Non-Hispanic Black, Hispanic white, Non-Hispanic white, etc. Additional data obtained from California, New York City, and Chicago, which report arrests to their own reporting systems, also include breakdowns of arrests by race and ethnicity. Altogether, we obtained arrest data permitting disaggregation by race and ethnicity from 6,235 jurisdictions in the Police Scorecard covering 68% of the nation's population and 73% of the nation's Hispanic population.
An additional 3,139 jurisdictions, representing 13% of the US population, reported Hispanic arrests under the more simplified Uniform Crime Reporting (UCR) system only. Since UCR data does not specify which of these Hispanic arrestees were also included in the white or Black arrest totals, we used Census data in each jurisdiction to estimate the proportion of Hispanic arrestees who are likely categorized racially as white or Black. Since the UCR reported Hispanic arrests data from 2017-2022, we used the proportion of Hispanic arrests relative to overall arrests reported during this period to estimate the number of Hispanic arrests overall, as follows:
- Hispanic Arrest Proportion = Hispanic arrests 2017-2022 / Total Arrests 2017-2022
- Overall Hispanic Arrests = Hispanic Arrest Proportion x (White Arrests + Black Arrests).
Importantly, this methodology assumes that Hispanic arrests are either categorized as White or Black in the data reported to the UCR. In practice this may not always be how agencies code Hispanic arrests, but based on race and ethnicity data from larger agencies this appears to be a reasonable assumption. After estimating the number of Hispanic arrests as described above, we estimated the number of those Hispanic arrests who were likely racially classified as White or Black using the Census proportions for the percentage of the population in that jurisdiction who identify as White and Hispanic, or Black and Hispanic. The proportions were calculated as follows:
- Black-Hispanic Proportion = Census Percentage Black and Hispanic / (Census Percentage Black and Hispanic + Census Percentage White and Hispanic)
- White-Hispanic Proportion = Census Percentage White and Hispanic / (Census Percentage Black and Hispanic + Census Percentage White and Hispanic)
Then to estimate the number of Hispanic arrests that were racially Black or White, we computed:
- Black-Hispanic Arrests = Black-Hispanic Proportion x Black Arrests
- White-Hispanic Arrests = White-Hispanic Proportion x White Arrests
- Non-Hispanic Black Arrests = Black Arrests – Black and Hispanic Arrests
- Non-Hispanic White Arrests = White Arrests – White and Hispanic Arrests
For some agencies, these computations resulted in negative values for Non-Hispanic Black Arrests or Non-Hispanic White Arrests, in which case we reallocated the number of Black-Hispanic Arrests or White-Hispanic Arrests to the other race category so that the negative arrests would equal 0.
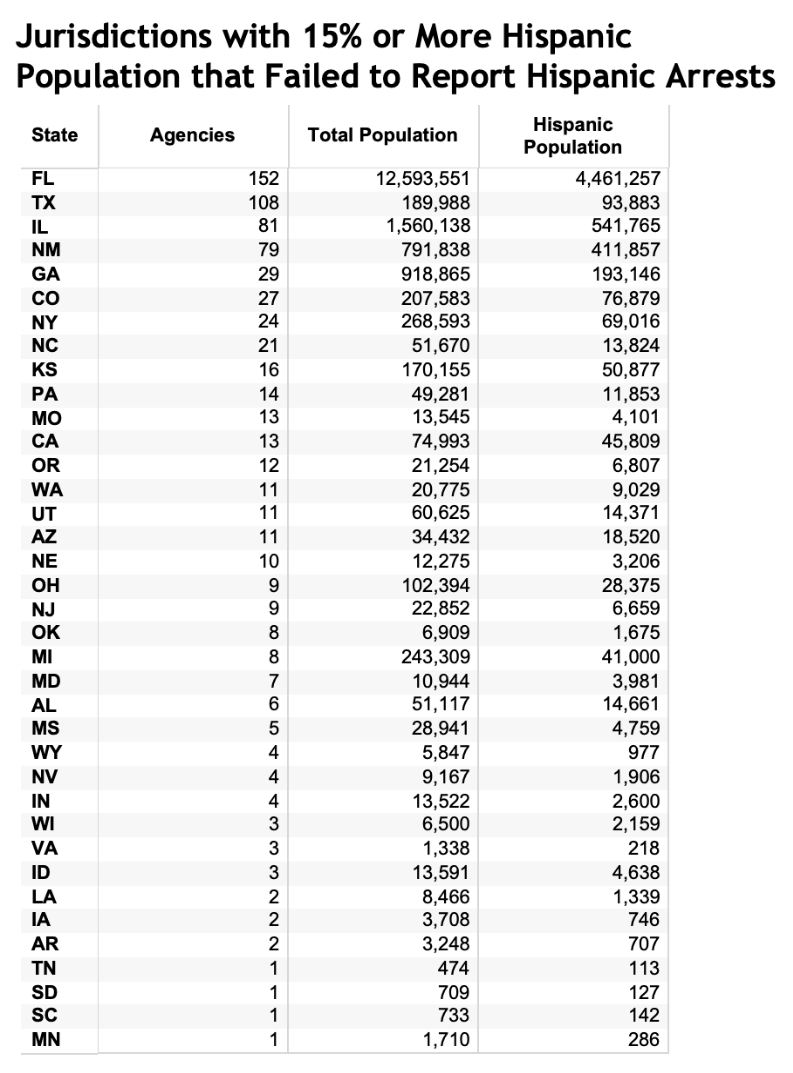
The remaining 6,651 agencies in the Police Scorecard did not report any Hispanic arrests to the federal government. While most of these agencies have relatively small Hispanic populations, 715 of the non-reporting agencies have jurisdictions where 15% or more of the population is Hispanic according to the 2020 Census. These 715 jurisdictions, representing 4% of all agencies within the Police Scorecard, are excluded from analyses of arrests disparities because they have an unspecified but potentially substantial number of Hispanic arrestees categorized racially as white. A breakdown of these jurisdictions by state is provided below.
HOMICIDES REPORTED AND HOMICIDES SOLVED
DEFINITION: THE TOTAL NUMBER OF CRIMINAL HOMICIDES REPORTED AND THE TOTAL NUMBER CLEARED BY ARREST OR EXCEPTIONAL MEANS FROM 2013-2024
We obtained data on the number of criminal homicides reported and those that were cleared from 2013-2024 from the FBI Uniform Crime Report and Supplementary Homicide Report databases. Consistent with the definitions used by these databases, criminal homicides are classified as murder and non-negligent manslaughter but exclude suicides, accidents, "justifiable homicides" and deaths caused by negligence. Homicides were classified as "cleared" when they resulted in either an arrest or were cleared through "exceptional means" (These are cases in which there is sufficient evidence but an arrest is reportedly not possible, for example, if the person suspected has died). We recognize that homicides cleared by arrest or exceptional means is an imperfect measure of murders "solved," for a variety of reasons (for example, not everyone arrested ends up being guilty of the offense). However, the Uniform Crime Report does not distinguish between these outcomes and, as such, we are limited by the data that are currently available.
We also included in the scorecard statistics on proportion of homicides cleared by race of the victim. Since the Uniform Crime Report did not disaggregate agency-level homicide clearance rates by race of victim, we relied on the Supplementary Homicide Report (SHR) database with enhanced case-level data from the Murder Accountability Project (MAP) to determine the percent of homicides "solved" by race of the victim for each jurisdiction from 2013-2024. Importantly, since homicides tend to be reported to the SHR database an average of 5 months after each incident (depending on jurisdiction), fewer homicides are reported as solved in this dataset compared to the end-of-year Uniform Crime reports. According to MAP, 5-10% of homicides reported as unsolved at the time of reporting to the SHR were cleared later. As such, the SHR data should be interpreted as the proportion of homicides solved within a shorter time frame than the UCR, which is useful for evaluating police efficacy at solving homicides given the race of the victim.
POLICE FUNDING
DEFINITION: THE TOTAL AMOUNT OF MONEY SPENT ON POLICING BY EACH CITY OR COUNTY FROM 2010-2023
This includes data on the total amount of city budget expenditures spent on policing in each city or county from 2010-2023 as reported to the Census Bureau's Annual Survey of State and Local Government Finances. For many cities, we were also able to obtain data from budgetary documents on local governments' websites and the police funding data for 72 large cities created by the Vera Institute. The Scorecard also includes data on each local government's expenditures on other issues that impact public safety - such as funding for Health and for Housing and Community Development. In some cases, we found discrepancies between the Census Bureau's data and the data included in a city or county's budget documents. Where such discrepancies were found, we used the data in the city or county budget documents in our analysis, given they often provide more detail.
We used the definitions established by the US Census Bureau to evaluate agency funding:
Police expenditures include all expenditures on police agencies; law enforcement activities of sheriff and constable offices; coroners; medical examiners; vehicular inspection activities; traffic control and safety activities; lock-up operations. The Census Annual Survey of State and Local Government Finances did not, however, include contributions to police pension funds as expenditures. Similarly, the amount of police expenditures represented in the Scorecard does not include spending on local court activities and correctional expenditures, which are tracked separately by the Census. Note that there may be differences between the amount of spending a local government reported to the Census and the spending projections published in budgetary documents. In order to ensure consistency across agencies, we relied on the Census data where possible.
Health expenditures includes expenditures for all public health activities, except the provision of hospital care which is tracked separately by the Census. Health expenditures include spending on all environmental health activities, health regulation and inspection, water and air pollution control, mosquito control, animal control warden, inspection of food handling establishments, ambulance and paramedic services not part of a fire department, public health nursing, vital statistics collection, and all other services performed directly by the public health department.
Housing and community development expenditures include all gross expenditures for urban renewal housing projects and similar activities.
FINES AND FORFEITURES
DEFINITION: THE TOTAL VALUE OF PROPERTY AND CASH CONFISCATED THROUGH ASSET FORFEITURE OR COLLECTED BY FINES, 2010-2023
This includes data on the total amount of city budget revenues collected through fines or forfeitures in each city or county from 2010-2023 as reported to the Census Bureau's Annual Survey of State and Local Government Finances. This measure can be used to assess potential excessive use of ticketing, civil asset forfeiture and other policing practices that often supplement police budgets by imposing an additional economic burden on communities.
TOTAL NUMBER OF OFFICERS
DEFINITION: THE NUMBER OF SWORN LAW ENFORCEMENT OFFICERS EMPLOYED AT EACH AGENCY, 2013-2025
This includes data specifying the total number of sworn law enforcement officers employed by each agency as reported to the UCR LEOKA program. Sworn officers are defined as employees who "ordinarily carry a firearm and a badge, have full arrest powers, and are paid from governmental funds set aside specifically to pay sworn law enforcement."
POLICE MISCONDUCT SETTLEMENTS
DEFINITION: THE AVERAGE AMOUNT SPENT ON POLICE MISCONDUCT SETTLEMENTS ANNUALLY FROM 2012-2014
This includes data specifying the average amount of money per year from 2012-2014 in settlements and judgements related to lawsuits against the 65 of America's largest law enforcement agencies - the largest study on this issue to date. Researchers obtained the data used in their analysis using public records requests to each agency, publishing the settlement amounts for each agency in the UCLA Law Review. In some cases, more recent data on police misconduct settlements were able to be obtained from recent media analyses.
[1] Since the FBI's UCR arrests database does not distinguish between lower level property crimes such as petty theft or shoplifting and more serious forms of theft, we were not able to include any arrests for petty theft or shoplifting within the low level arrests category. Similarly, arrests for non-DUI related traffic offenses are not reported to the UCR program. This likely results in an undercount of the total number of low level arrests made by each agency.
[2] To avoid imprecise or unreliable estimates of this proportion, we excluded departments who had categorized fewer than 25% of their arrests by ethnicity or had fewer than 50 arrests categorized by ethnicity.