TABLE OF CONTENTS
WE EVALUATED POLICING IN AMERICA. HERE'S WHAT WE FOUND.
Nationwide protests have shifted public opinion in support of systemic change. But while public opinion is changing, the police have continued to kill people at similar rates this year as they did last year. In a nation with thousands of law enforcement agencies, each with different issues and outcomes, changing policing outcomes on a nationwide scale requires sustained organizing and advocacy efforts in every jurisdiction. To do this, communities need the tools to effectively monitor police behavior and hold cities and counties accountable to producing measurable change.
To obtain and publish this information, we submitted public records requests to local police departments and combined the data obtained from these departments with federal databases tracking crime, arrests, financial and personnel records from thousands of municipal and county governments. This represents one of the largest-scale examinations of policing outcomes in the United States - including every municipal police department and county sheriff's department in the country. Here are initial findings from our analysis:
1. Police continue to hide substantial amounts of data from the public
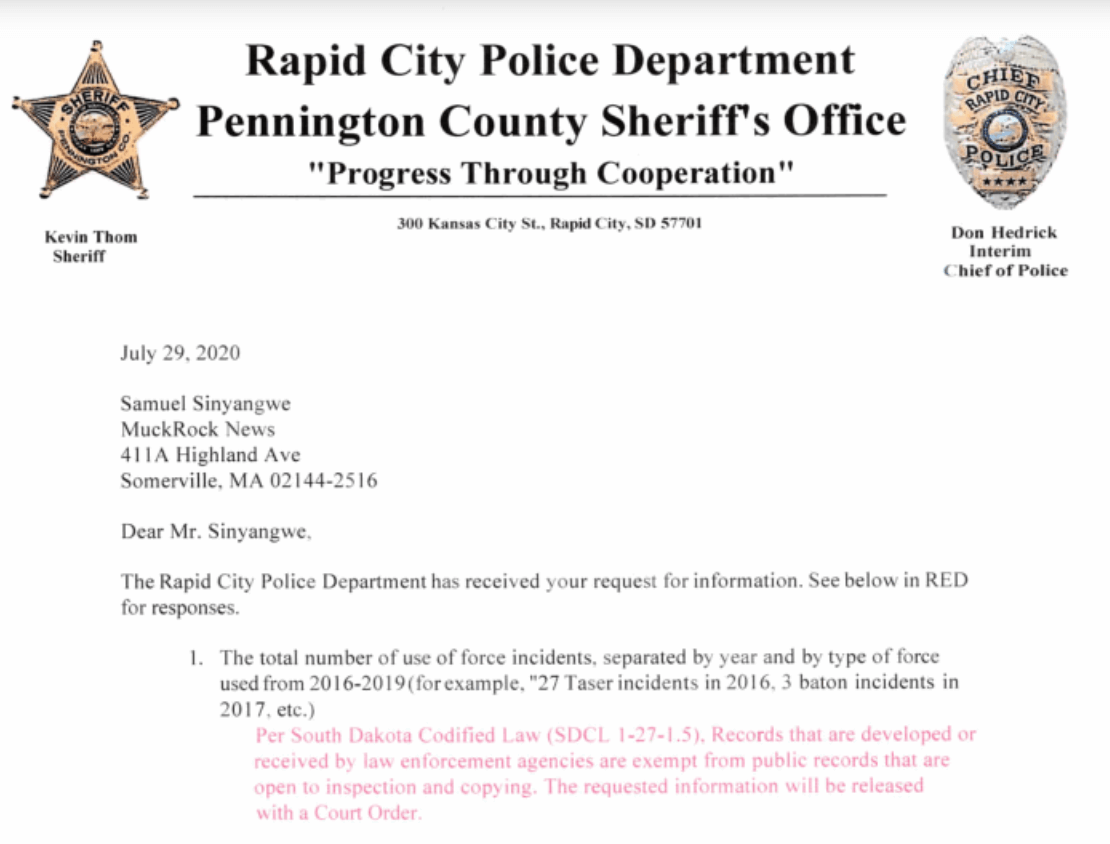
The federal government does not publish comprehensive data on police violence or misconduct. In 36 states, laws restrict or prohibit agencies from making these records public. Even in states where this information is supposed to be public record, local police agencies often refuse to comply with public records requests or charge exorbitant fees to produce these records. In some cases, like Rapid City South Dakota, police have refused to provide even basic data on police use of force unless a court orders them to make these records public.
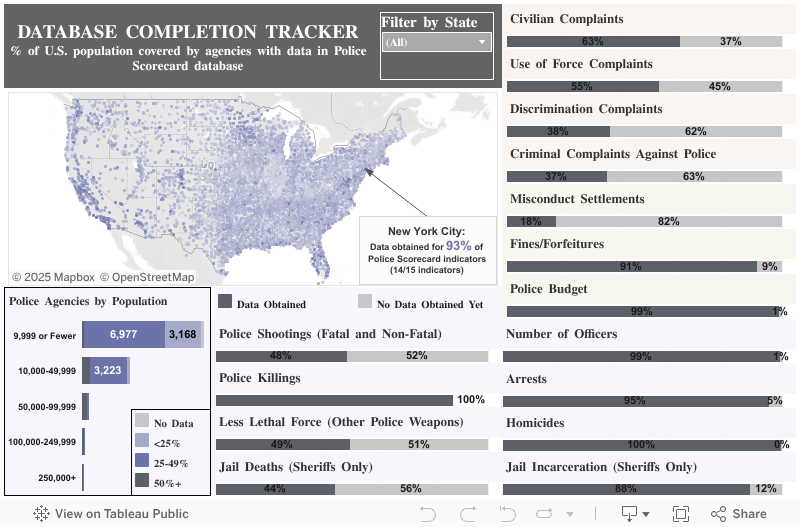
As such, there are substantial limitations to the data we are able to collect from agencies and limitations on our capacity to make comparisons between agencies - especially when it comes to outcomes such as police misconduct complaints and police use of force. This is an ongoing project and more data will be published as it is obtained. Track our progress in compiling the data on use of force, misconduct complaints, arrests, police budgets and other indicators from over 16,000 law enforcement agencies using the interactive visualization below.
2. Policing differs substantially depending where you live
How Police Departments Are Compared:
The Police Scorecard includes data on all police and sheriff's departments that are the primary law enforcement agency for their jurisdiction. Each agency's reported outcomes are compared to the outcomes reported by other agencies of the same type, generally grouped by the following agency types:
- Municipal Police Departments
- County Sheriff's Departments
Among agencies of the same type, scores are calculated as percentiles relative to other departments with similar sized jurisdictions:
- < 50,000 residents
- 50,000 - 100,000 residents
- 100,000 - 250,000 residents
- 250,000+ residents
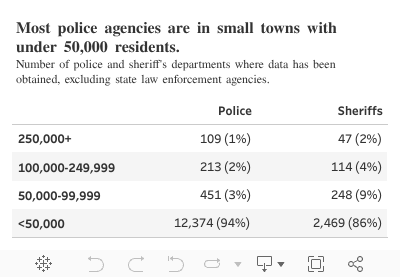
Over 80% of the agencies in the Police Scorecard are municipal (city or town) police departments while the remaining agencies are county sheriff's departments. The vast majority of these agencies represent small towns and cities, with 93% of all agencies in the Scorecard policing in jurisdictions with fewer than 50,000 residents.
Most police agencies have jurisdictions with fewer than 50,000 residents.
State-Level Policing Outcomes
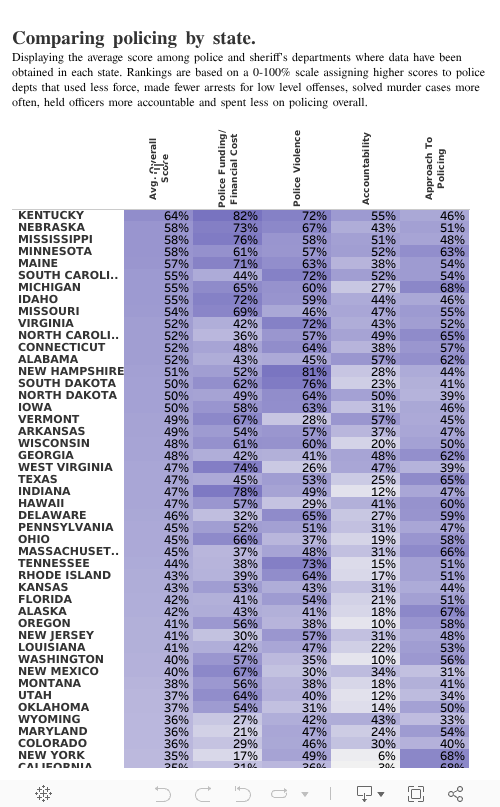
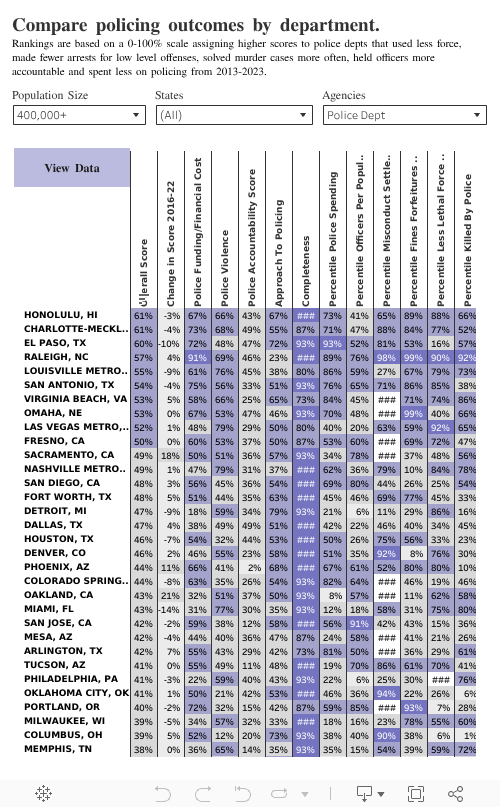
Policing outcomes varied by state. To compare agencies, we calculated scores for each agency using a 0-100% scale whereby departments with higher scores use less force, make fewer arrests for low level offenses, solve murder cases more often, hold officers more accountable and spend less on policing overall (Read more about our methodology here). Applying this methodological framework to compare states with one another based on the available data on these outcomes, we find some states have substantially better policing outcomes overall than others according to the data that we have obtained to date.
Local-Level Policing Outcomes
There was also substantial variation in policing outcomes among city police departments and county sheriffs within each state - with the lowest scoring departments receiving scores at or below 30% and the highest scoring departments receiving scores above 60%. Among the largest police jurisdictions, those with over 400,000 population, Charlotte-Mecklenburg and El Paso police departments had among the highest overall scores - making fewer low level arrests, using less force, and spending less on policing than other big city police departments. Further exploration of the organizational culture, leadership and practices of these departments might produce valuable insights into how to improve outcomes in other places. By contrast, police departments in Chicago, Long Beach and Kansas City, MO had among the worst outcomes. This suggests the need for further investigation and intervention from local, state and federal authorities to better understand and address these issues.
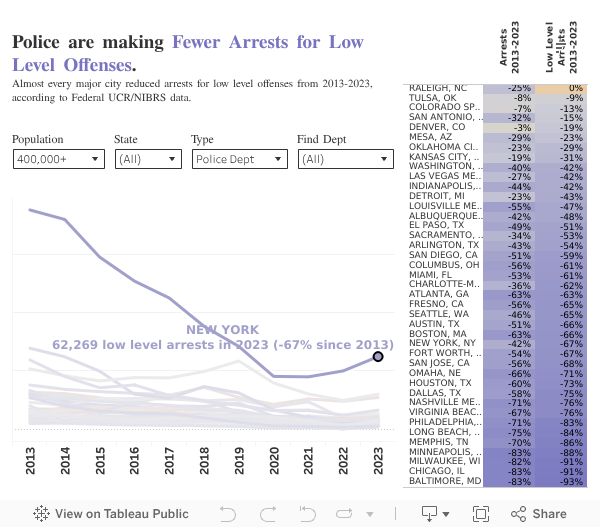
3. Police are making fewer arrests for low level offenses
Two-thirds of all arrests reported by law enforcement nationwide in 2020 were for low-level offenses, which include loitering, disorderly conduct, substance use, sex work and other offenses that are not crimes against people or property. This is 12x as many reported arrests as were made for violent crimes. Among big cities, police in Seattle, Boston and Detroit had the lowest arrest rates for low level offenses. By contrast, Louisville police arrested people for low level offenses at 5x higher rate than these cities. While some of these differences could reflect differences in crime, such large disparities between cities suggest major differences in how each city approaches law enforcement.
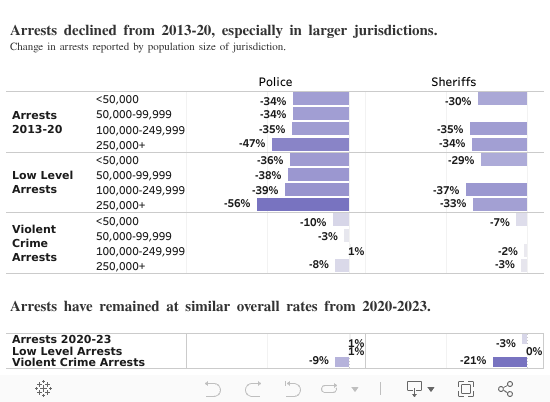
Larger jurisdictions appear to be shifting their approach to law enforcement more quickly than other parts of the country. Agencies representing jurisdictions with over 400,000 residents reported 46% fewer arrests overall and 53% fewer arrests for low level offenses in 2020 than they did in 2013 - exceeding the 34% reduction in arrests and 36% reduction in low level arrests reported by other agencies during this time period. Cities like New York, Houston, Minneapolis, Miami, Boston, Raleigh, Milwaukee, Nashville and Fort Worth led other big cities in reducing arrests for low level offenses - cutting these arrests by more than 60% from 2013-2020. These declines in the enforcement of low level offenses did not appear to change how agencies approached violent crime - jurisdictions with over 400,000 population made a similar number of arrests for violent crime in 2020 that they made in 2013, while smaller jurisdictions reduced violent crime arrests during this period.
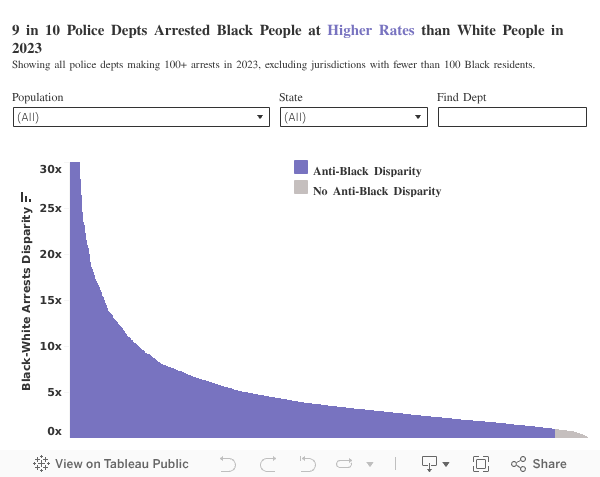
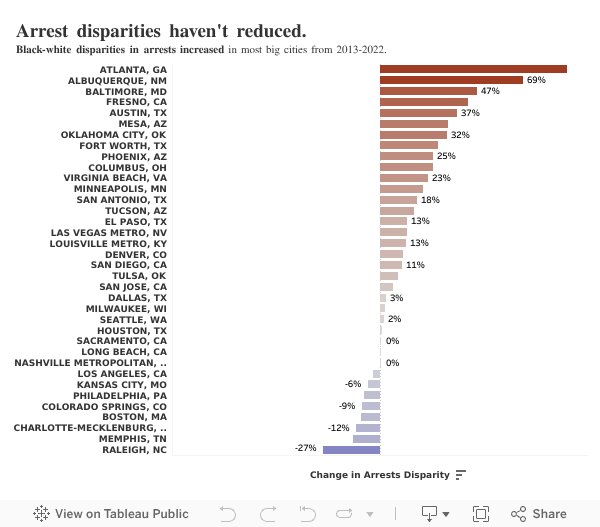
4. As arrests decline, racial disparities persist
Black people were arrested at higher rates than white people in 90% of police jurisdictions reporting 100 or more arrests in 2020 - including every police department with a jurisdiction of over 400,000 population. Despite research showing Black and white people use drugs at similar rates, three-quarters of police departments arrested Black people for drug possession at higher rates than white people. Moreover, despite an overall decline in drug possession arrests in big cities, Black-white arrest disparities in these arrests have grown in many cities since 2013, a trend that has been cited in previous research.
Though there were racial disparities in arrests in almost every jurisdiction, the most severe disparities tended to be found in smaller towns and cities. Of the 500 departments with the largest Black-white racial disparities in arrests, 4 in 5 had a population of fewer than 15,000 people. This highlights the need to expand and deepen policy and practice interventions beyond the largest cities to also reach more rural and small city jurisdictions.
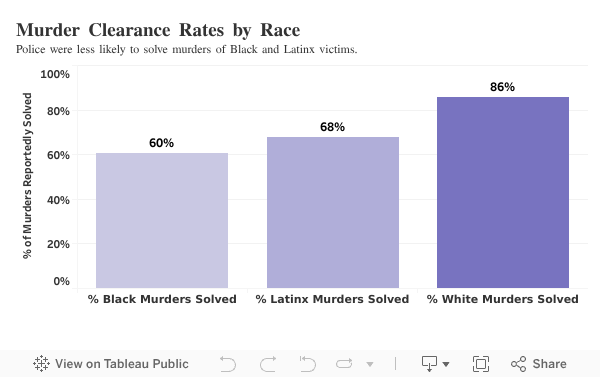
Disparities in Murder Clearance Rates
While police were more likely to arrest Black people for low level offenses, they were less likely to find someone responsible for the most serious offense - homicide - when the victim was Black. Nationwide, police reported finding a suspect in 84% of homicides of white victims from 2013-2020 compared to only 64% of Latinx victims and 57% of Black victims.
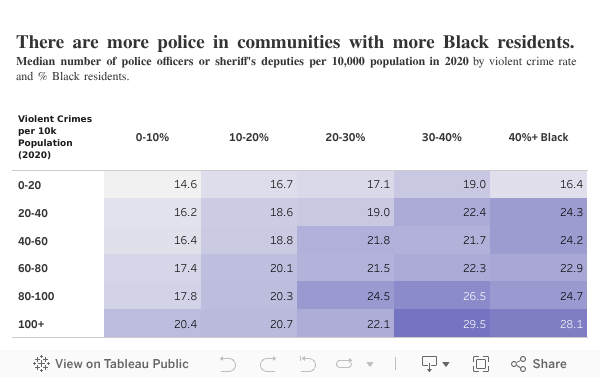
5. Black communities are more heavily policed
In addition to widespread racial disparities in arrests and murder clearance rates, communities with more Black residents tended to be more saturated with police officers, with more police officers per population, and also tended to spend more money on policing overall. Moreover, police agencies in Black communities confiscated more money and resources from residents through fines and forfeitures than police agencies in other jurisdictions. Even among jurisdictions with similar violent crime rates, there are consistently more police officers in communities where more Black people live.
6. Some police departments show a clear pattern of using more force than other departments.
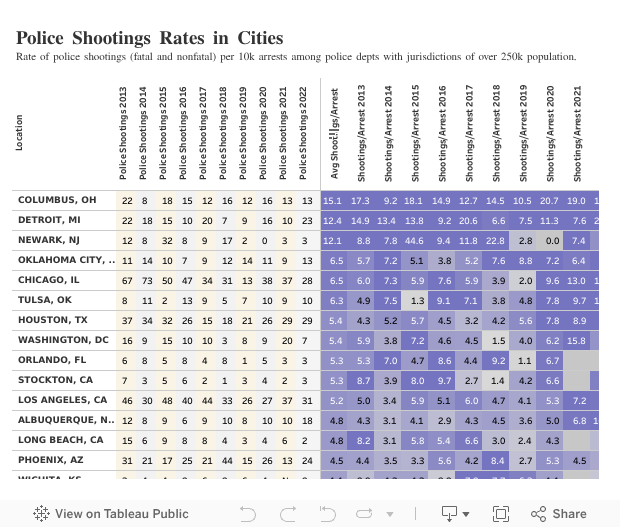
Police Shootings
Examining data obtained from big city police agencies on both fatal and nonfatal police shootings incidents from 2013-2021, police in New York City, Miami and Oakland had among the lowest rates of police shootings per every 10,000 arrests they made. Detroit, Columbus, Kansas City and Oklahoma City consistently had among the highest rates of police shootings each year. This suggests the need for urgent interventions from the US Department of Justice and/or state Attorney's General to restrict police use of force standards and strengthen independent accountability structures in these cities.
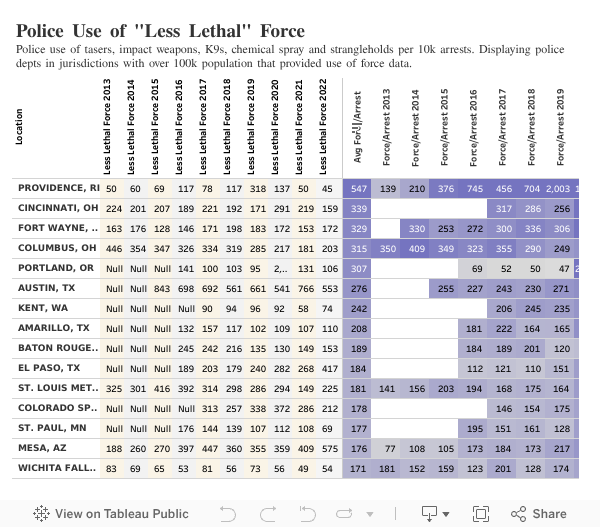
Other Forms of Police Use of Force
We obtained detailed use of force data from more than 1,200 police agencies indicating the number of uses of police tasers, batons, K-9s, strangleholds, pepper spray and other force involving weapons each year. Police in Tallahassee, Orlando, Long Beach and Vallejo used these forms of “less lethal” force at higher rates than other large departments, while Las Vegas, Reno and Plano, TX had among the lowest rates of “less lethal” force among the cities we obtained use of force data from.
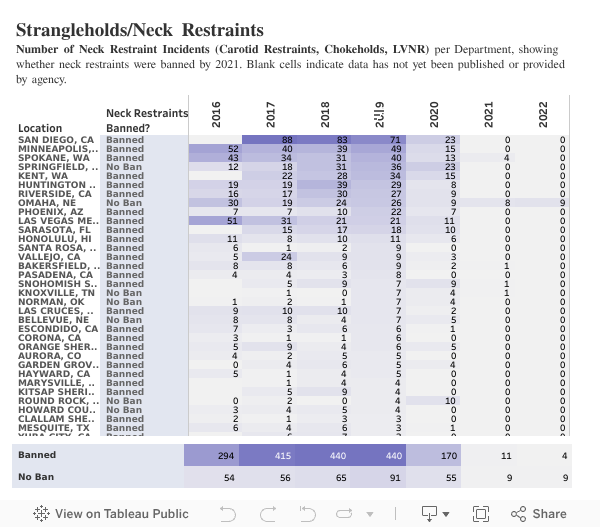
Chokeholds and Strangleholds:
Of the departments providing use of force data, more than 120 departments explicitly reported using neck restraints against civilians (including Lateral Vascular Neck Restraints, Carotid Restraints and Chokeholds). Of these, the data show that a few departments were consistently outliers in using this tactic against people. Police departments in San Diego, Long Beach and Minneapolis consistently reported using strangleholds against civilians at higher rates per arrest than other large police departments. Following widespread protests over the murder of George Floyd, these cities banned strangleholds in June 2020. Altogether, these three agencies reported 74% fewer neck restraint incidents in 2020 than they reported in 2019.
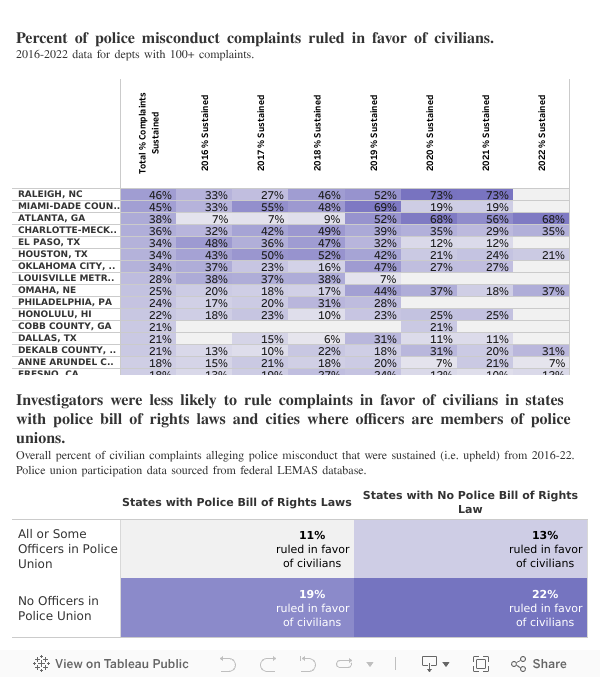
7. Few departments regularly rule against officers in misconduct investigations
When people come forward to report police misconduct, it rarely leads to accountability. Among the over 1,500 departments we obtained civilian complaint data from, only 1 in every 9 civilian complaints of police misconduct was ruled in favor of civilians. Of the 510 jurisdictions that reported 25 or more complaints, only 19 jurisdictions (4%) sustained the majority of civilian complaints reported to them. Among larger cities, Houston, Miami-Dade and Raleigh police sustained complaints in nearly half of all cases, suggesting the need for further examination of potential best-practices used by investigators in these jurisdictions to substantiate misconduct. Consistent with past research finding that police union contracts undermine accountability, departments were more likely to sustain misconduct complaints against officers in states like GA, TN, SC and NC that do not allow police unions to negotiate these contracts. By contrast, departments in states with "Police Bill of Rights" laws were less likely to sustain complaints of police misconduct - suggesting that these laws may also be barriers to police accountability. Importantly, since no nationwide database exists to track police disciplinary consequences resulting from substantiated complaints, we do not know the full extent to which officers are held accountable even in many of the agencies with higher rates of sustained complaints.
Among the types of allegations reported, more serious allegations like excessive force or discrimination allegations were even less likely to be ruled in favor civilians than other complaints. Civilians reporting police discrimination had only a 1 in 54 chance of their complaint being upheld and civilians reporting use of force complaints had only a 1 in 31 chance of being upheld. This lack of administrative accountability for police violence mirrors the criminal justice system's approach towards police violence. Only 2% of all killings by police from 2013-2021 have resulted in an officer being charged with a crime and 1% of killings resulted in a criminal conviction.
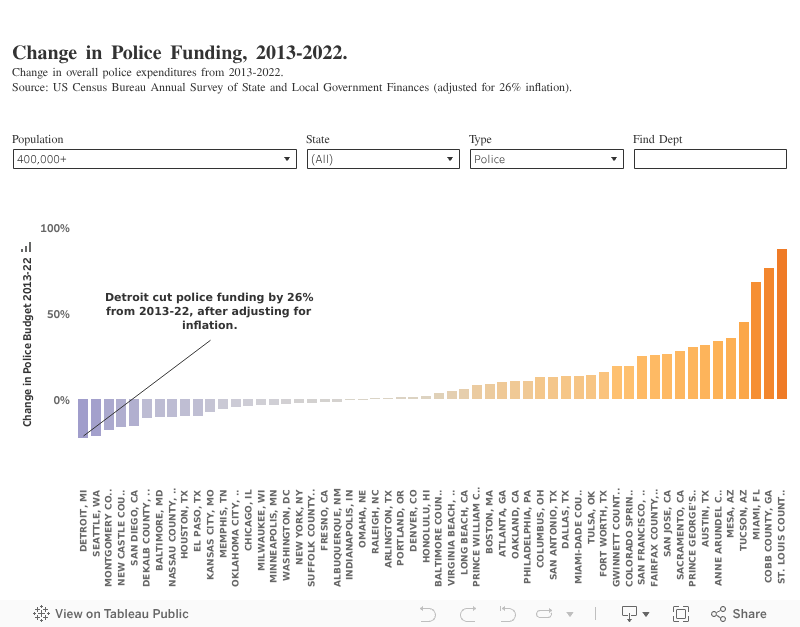
8. 79% of jurisdictions increased police funding from 2013-2020
Local government finances data reported to the US Census Bureau shows residents spend substantially different amounts on policing depending on which jurisdiction they live in - for example, residents in Baltimore City, Oakland and New York City spent 3-4x more per capita on policing than residents in El Paso, Virginia Beach or Indianapolis in 2020 (the latest year of data published by the Census Bureau). Police funding increased in almost every jurisdiction from 2013-2020 - the median jurisdiction increased police spending by 14% after adjusting for inflation.
21% of jurisdictions cut police funding from 2013-2020 after accounting for the estimated 10.4% inflation during this period, according to the Census data. A review of municipal budgetary documents along with the Census data found only one of the nation's largest cities (over 400k population) cut police spending more than 10% from 2013-2020 - Detroit. Detroit's police budget was 12% lower in 2020 than it was in 2013, after adjusting for inflation. The city reduced police funding by 30% between 2014-15, in addition to making cuts to other agency budgets, after filing for municipal bankruptcy. However, the Detroit police budget has continued to grow each year since these initial budget cuts were implemented in 2015.
CONCLUSION
When these outcomes are evaluated together, it reveals a disturbing picture of policing across the nation. While the federal government collects and publishes data on crime, arrests and police personnel from the vast majority of America's police agencies, only a fraction of these agencies make data available on police use of force, misconduct complaints, or settlements. Where such data are available, they show racially disparate policing outcomes and low rates of upholding police misconduct complaints in almost every location. Altogether, most departments received a score lower than 50% and almost no departments scored higher than 70%, suggesting the need to thoroughly reimagine and transform the way the vast majority of cities and counties in the United States approach public safety.
The data also reveals that the nation's largest law enforcement agencies reduced police shootings by 25% and cut arrests for low level offenses by more than half since 2013. At the same time, Black communities continue to be disproportionately impacted by these policing practices and, even in many of these same cities, racial disparities are increasing. And the data also identify police departments that consistently demonstrate worse outcomes than other agencies - using force at multiple times the rate of the average agency of their size. These findings suggest the need for urgent investigations and interventions prioritizing the lowest-performing departments - especially smaller towns and big cities where racial disparities are most severe/increasing most rapidly. This includes interventions from local policymakers and pattern/practice investigations by state and federal attorneys general.
Back to Top